Gorilla Terminal: AI Investment Research & Quant Tools
Gorilla Terminal is an AI-powered investment research platform that combines quant analysis, macro data, and risk management to speed up your research process.
Overview
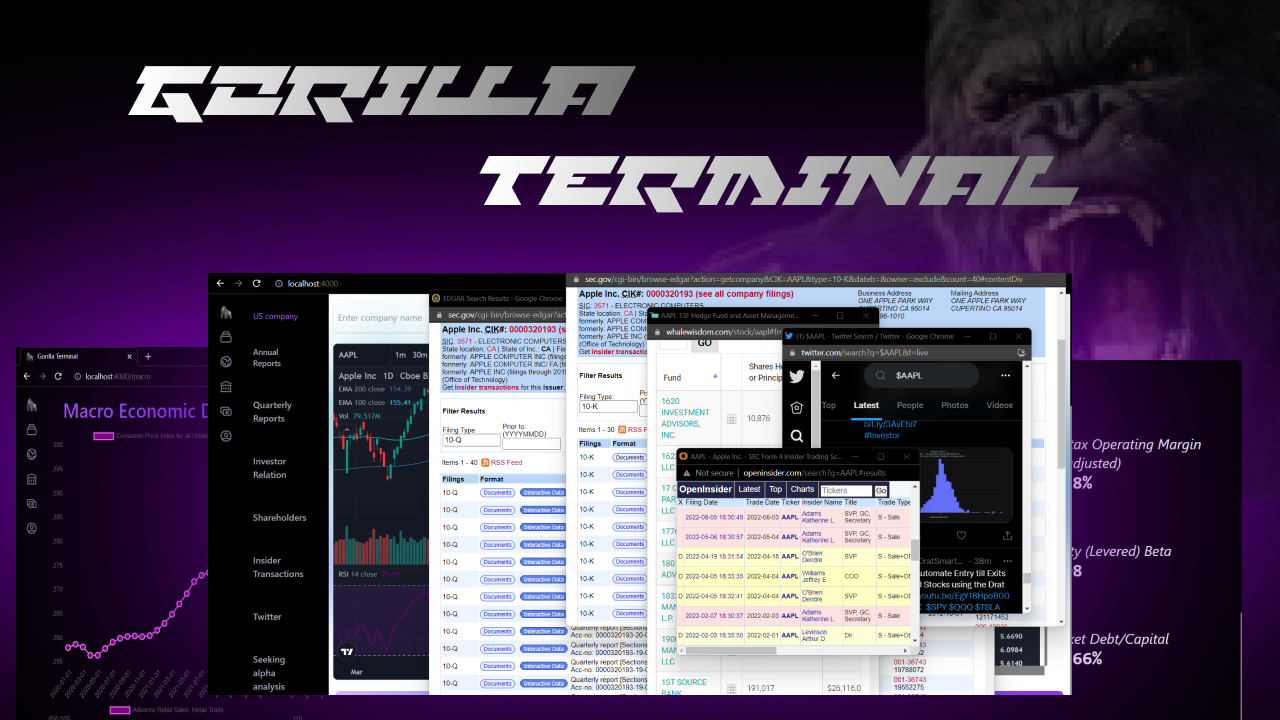
Gorilla Terminal reimagines investment research as an AI-first experience, condensing hours of manual analysis into minutes. The platform merges quantitative techniques, macroeconomic indicators, and risk management tools into a single intuitive dashboard, giving investors and analysts a unified command center for decision-making. Instead of juggling multiple data sources and spreadsheets, users can search any stock by name or ticker to instantly surface charts, SEC filings, quarterly reports, insider trading activity, and social sentiment—all in one view.
What sets Gorilla Terminal apart is its AI-driven earnings call analysis, which extracts sentiment and revenue growth signals from transcripts far faster than manual review. Add in access to macro data like CPI and unemployment figures, plus regression and quant modeling capabilities, and the platform positions itself as a serious toolkit for anyone serious about optimizing risk and return. The goal is simple: make research 10x faster without sacrificing depth or accuracy.
Capabilities & Features
- AI investment research
- Quant analysis
- Macro data
- Risk management
- Earnings call analysis
- Stock analysis
- Financial data
- Sentiment analysis
Core Features
- AI-driven investment research engine
- Macroeconomic data access (CPI, unemployment, etc.)
- Risk management and quant analysis tools
- AI-powered earnings call sentiment analysis
- All-in-one dashboard with SEC filings and insider data
- Social sentiment tracking from Twitter
Use Cases
- Analyzing earnings call transcripts for sentiment shifts and revenue growth signals
- Pulling macroeconomic indicators to inform top-down investment strategy
- Applying quant techniques to optimize portfolio risk and return
- Running regression analysis to uncover financial trends
- Tracking supply chain and insider activity to gauge company health
Best For
- Individual investors
- Financial analysts
- Portfolio managers
- Independent researchers
- Active traders
Pros
- •Consolidates macro data, filings, and sentiment into one dashboard
- •AI-powered earnings call analysis saves significant research time
- •Includes quant and risk management tools not always found in retail platforms
- •Flexible pricing with a low-cost short-term pass option
- •Live market updates available on higher tiers
Cons
- •Higher-tier plans required to unlock advanced industry analysis and live updates
- •No transparent refund or cancellation policy listed
- •Data security and storage practices are not clearly documented
- •May require some financial/quant background to fully leverage advanced features
How to Use
1. Log into the Gorilla Terminal dashboard. 2. Search for any stock using its name or ticker symbol. 3. Review the generated data, including price charts, SEC filings, quarterly reports, insider buying activity, and Twitter sentiment. 4. Use the AI tools to analyze earnings calls for sentiment and revenue trends. 5. Pull macroeconomic data (like CPI or unemployment rates) to contextualize your investment thesis. 6. Apply quant and risk management tools to refine your portfolio decisions.
Frequently Asked Questions
Open in AI Studio
Ask our AI to evaluate if Gorilla Terminal fits your specific workflow.
Connect & Contact
Pricing
Gorilla Terminal offers a one-time $9.99 7-day pass for short-term access, with ongoing plans starting at $29/mo for individuals (Pro) and $99/mo for teams of five (Teams), all unlocking unlimited searches and full macro/quant data.
Pricing data is provided as a summary. Visit the vendor website for full tier details.