Connected Papers: Visual Academic Research Explorer
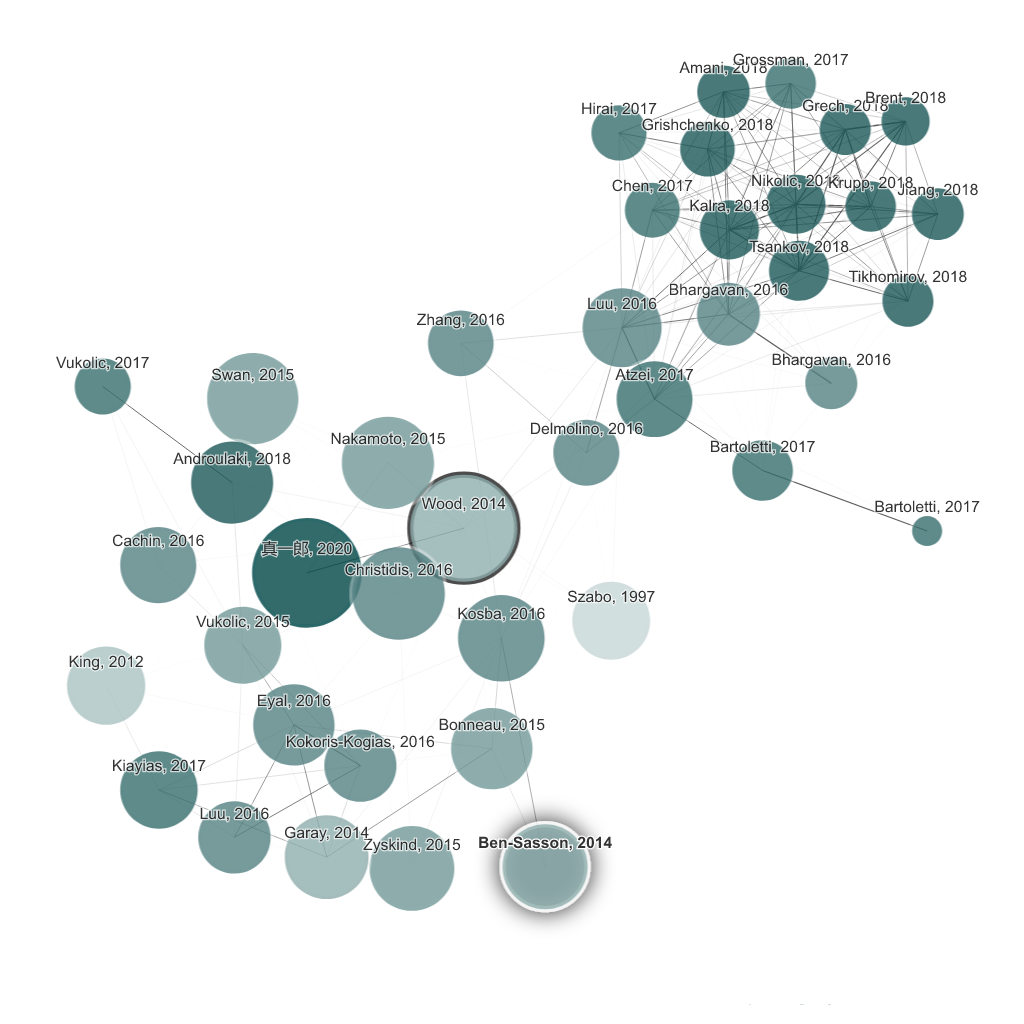
Connected Papers turns any academic paper into an interactive visual graph, helping researchers quickly map out related work and spot key studies they might have missed.
Overview
Connected Papers is a visual discovery tool built for researchers, students, and applied scientists who need to navigate the ever-growing landscape of academic literature. Instead of sifting through endless citation lists, users simply input a paper of interest and receive a dynamic graph showing how it connects to similar works in the field. This makes it far easier to spot influential papers, understand relationships between studies, and grasp the overall shape of a research area at a glance.
Powered by the massive Semantic Scholar database, the tool supports bi-directional exploration—letting users trace both the foundational research that inspired a paper and the newer studies that built upon it. Whether you're diving into an unfamiliar field, compiling a thesis bibliography, or just making sure you haven't overlooked an important publication, Connected Papers offers a faster, more intuitive alternative to traditional literature review methods.
With flexible pricing that scales from individual free use to institutional licensing, the tool is accessible to solo students as well as entire university libraries or corporate research teams, making rigorous literature mapping available at nearly every level.
Capabilities & Features
- Academic research
- Literature review
- Scientific papers
- Visual tool
- Semantic Scholar
- Research discovery
- Bibliography creation
- Prior works
- Derivative works
Core Features
- Automatic visual graph generation from a single input paper
- Bi-directional discovery of prior and derivative works
- Semantic Scholar-powered database covering hundreds of millions of papers across all scientific fields
- Quick identification of the most influential and popular papers in a topic area
- Visual mapping of relationships and dynamics between research areas
Use Cases
- Quickly getting oriented in an unfamiliar academic field
- Verifying no major papers have been missed amid a flood of new publications
- Building a well-rounded bibliography for a thesis or dissertation
- Tracing both the origins and follow-up research of a specific study
- Supporting library patrons or students with literature discovery
Best For
- Researchers
- Applied scientists
- Graduate and undergraduate students
- Academics and professors
- Librarians and library systems
Pros
- •Turns complex citation networks into an easy-to-understand visual map
- •Covers an enormous, cross-disciplinary database via Semantic Scholar
- •Free tier includes full feature access, just with a monthly graph cap
- •Bi-directional search saves time compared to manual citation chasing
- •Scalable plans for individuals, teams, businesses, and entire academic libraries
Cons
- •Free plan limited to just 5 graphs per month, which may be restrictive for heavy users
- •Relies entirely on Semantic Scholar's coverage, so gaps in that database could affect results
- •Group and library plans require quotes or added setup, adding friction for larger organizations
- •Visual graphs may still require manual verification for comprehensive systematic reviews
How to Use
1. Enter a paper you're already familiar with into Connected Papers. 2. The tool automatically generates a visual graph of academically similar papers. 3. Examine the graph to identify prior (foundational) and derivative (newer) works connected to your topic. 4. Click into other interesting papers within the graph to build additional graphs and expand your view of the field. 5. Use the accumulated visual insight to build bibliographies, spot trends, and confirm you haven't missed critical research.
Frequently Asked Questions
Open in AI Studio
Ask our AI to evaluate if Connected Papers fits your specific workflow.
Connect & Contact
Pricing
Connected Papers offers a fully-featured free plan capped at 5 graphs monthly, with unlimited-graph paid tiers starting around $3/month for academics and $10/month for business users (billed annually), plus custom group and library licensing options.
Pricing data is provided as a summary. Visit the vendor website for full tier details.